Monitoring, uptime and error tracking
Monitoring tools report app errors, outages and missed scheduled tasks.
Use for: Live apps, APIs and scheduled jobs.
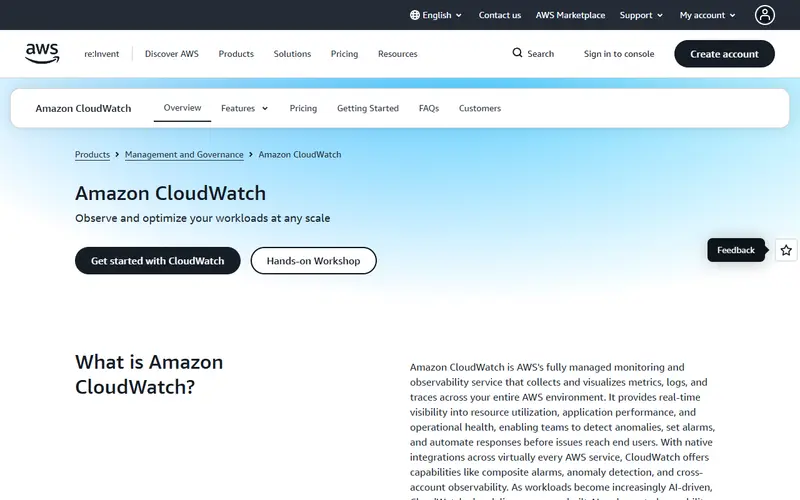
AWS's built-in monitoring service for metrics, logs, alarms, dashboards, X-Ray traces, synthetics and RUM, pay-per-use with a free tier and no minimum fee.
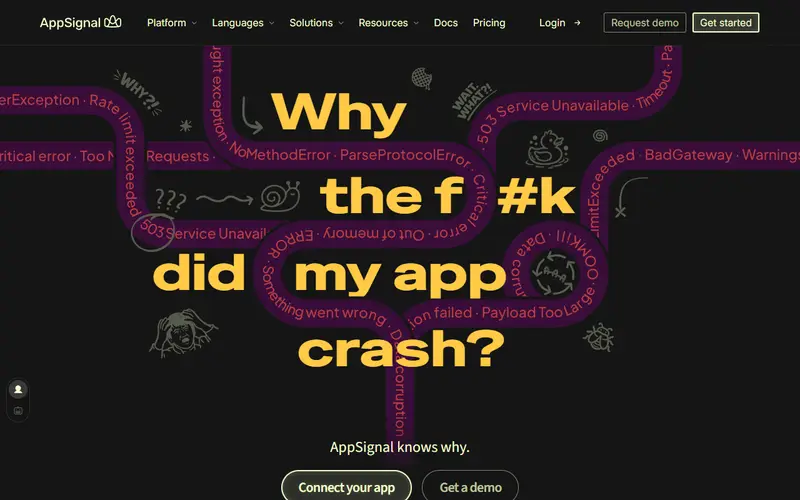
Amsterdam-based APM covering errors, performance, host metrics, logs, uptime and cron check-ins, priced by request volume with unlimited users and no overage charges.
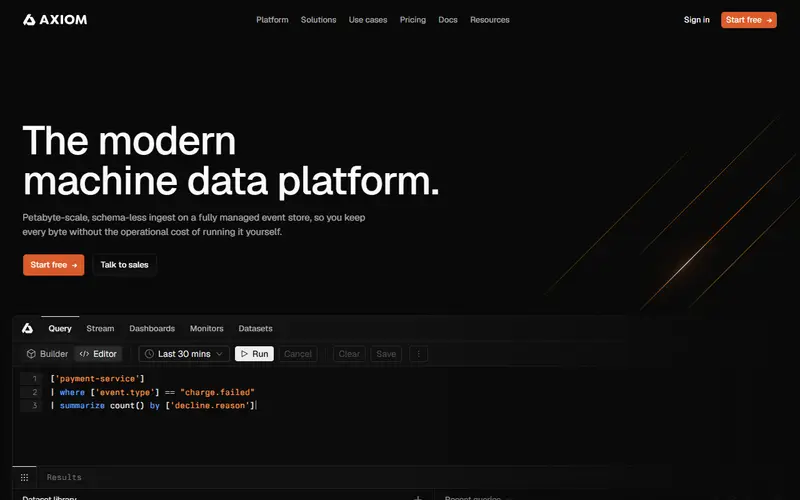
Managed store for logs, traces and events with schema-less ingest and a query language (APL), priced by compute usage with a permanent free Personal plan.
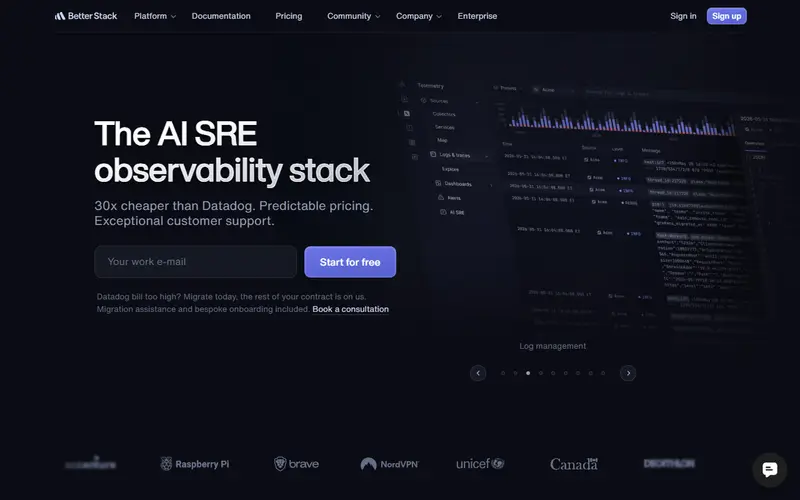
Uptime checks, status pages, on-call, logs, traces, metrics and Sentry-compatible error tracking in one product, with a generous free tier and cheaper EU data storage.
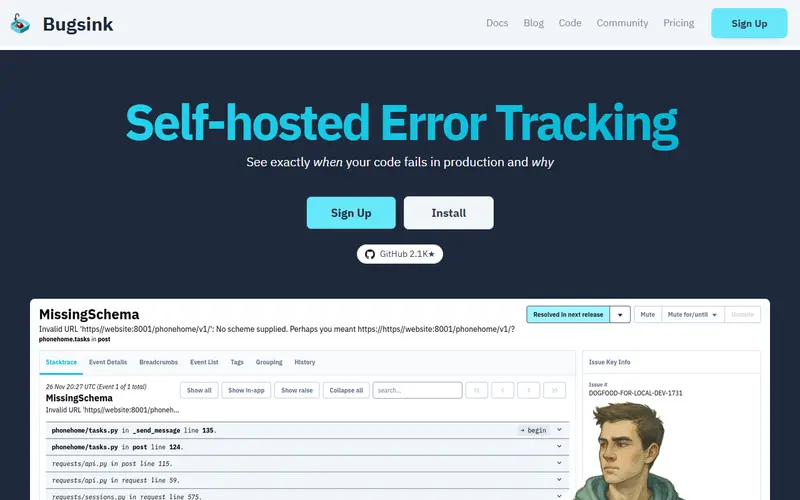
Lightweight error tracker that accepts Sentry SDKs, runs from one Docker container on your own server for free, or hosted in the EU from $16 a month.
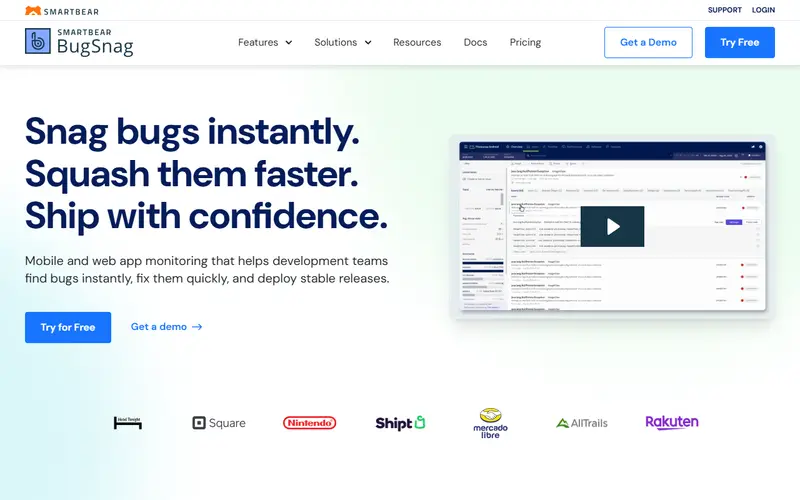
Error and performance monitoring from SmartBear with stability scores per release, strong mobile crash reporting, and an on-premises option for regulated teams.
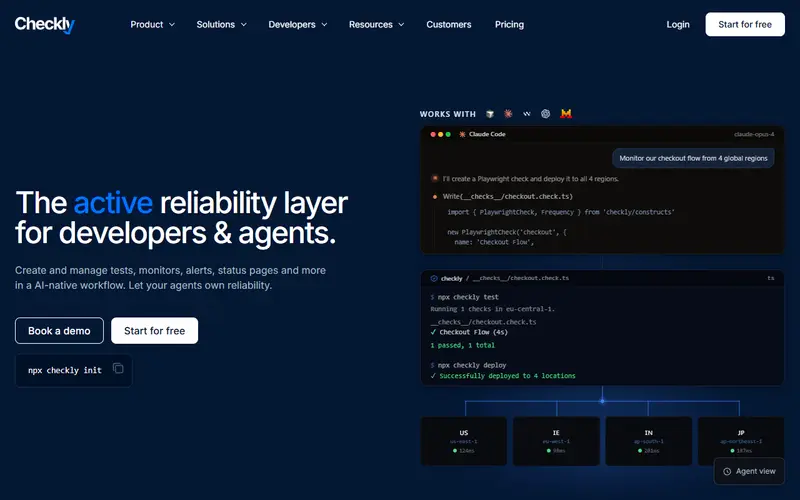
Monitoring-as-code for uptime, API and Playwright browser checks, defined in TypeScript or Terraform and run from 22 locations, with status pages and AI root-cause analysis.
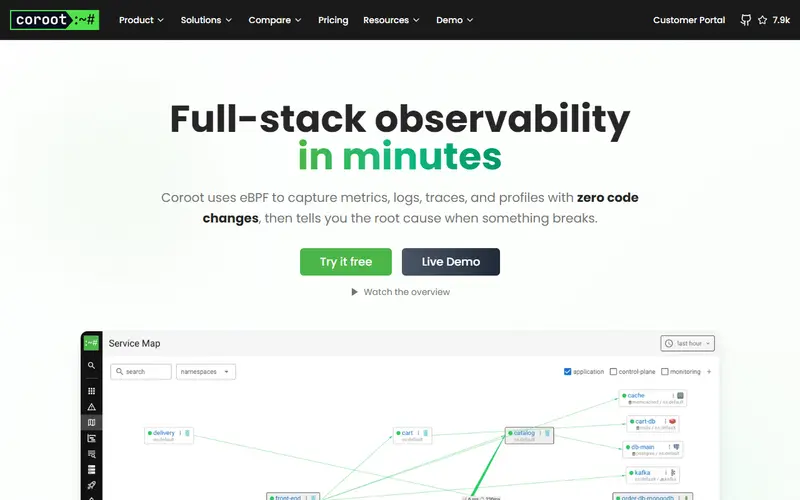
Self-hosted observability that uses eBPF to collect metrics, logs, traces and profiles with no code changes, then points to root causes; open-source edition free, commercial $1 per CPU core.
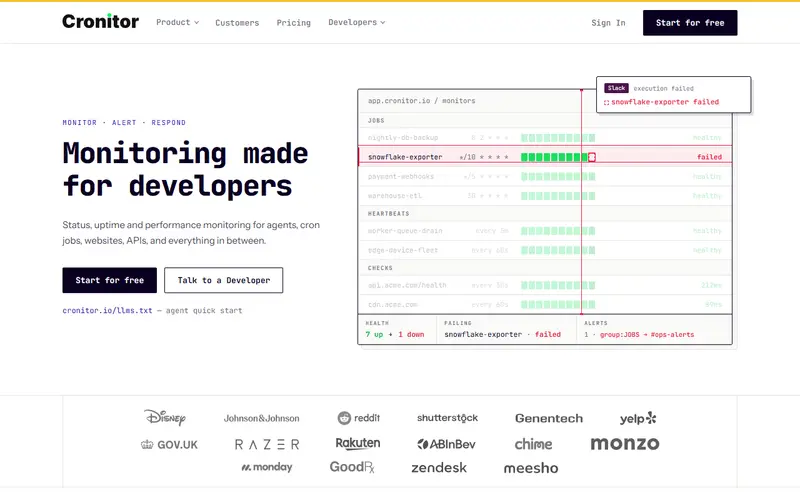
Monitoring for cron jobs, background workers, websites, APIs and heartbeats, with status pages and RUM, priced per monitor and per user.
OpenTelemetry-native observability for traces, logs, metrics, RUM and synthetics, priced per million signals with separate ingest and storage rates and an AI agent for root-cause analysis.
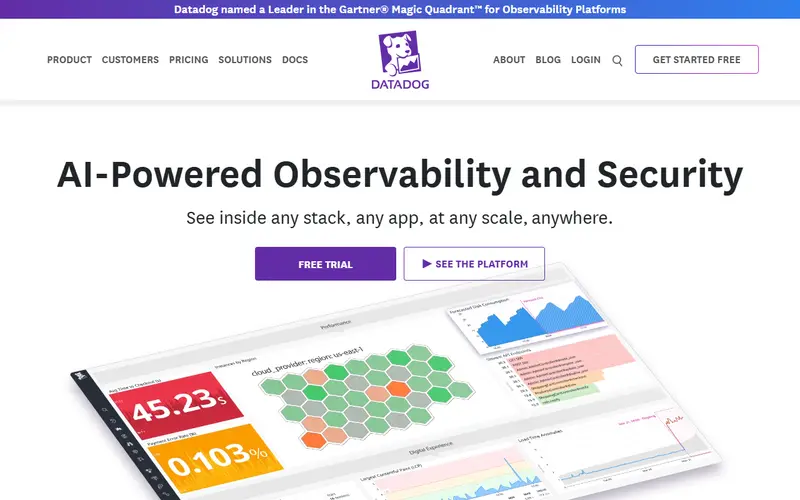
Broad SaaS observability platform priced per host and per data volume, covering infrastructure, APM, logs, synthetics, RUM and security in one account.
Open-source, Sentry-SDK-compatible error tracking with simple performance, uptime and log features, self-hostable or hosted from $15 a month in the US or Germany.
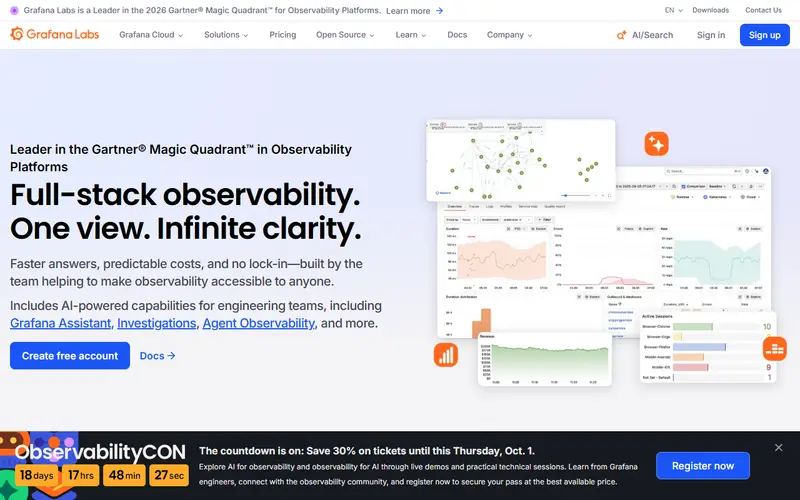
Hosted Grafana with managed Prometheus-style metrics, Loki logs, Tempo traces and profiles, built on open-source projects, with a permanent free tier and usage pricing.
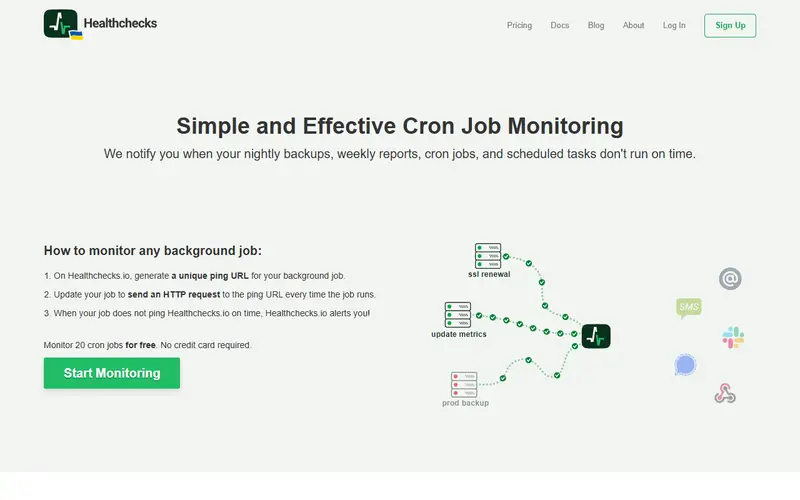
Simple, open-source cron job monitoring: jobs ping a unique URL and you are alerted when a ping is late, with 20 free checks and flat paid plans.
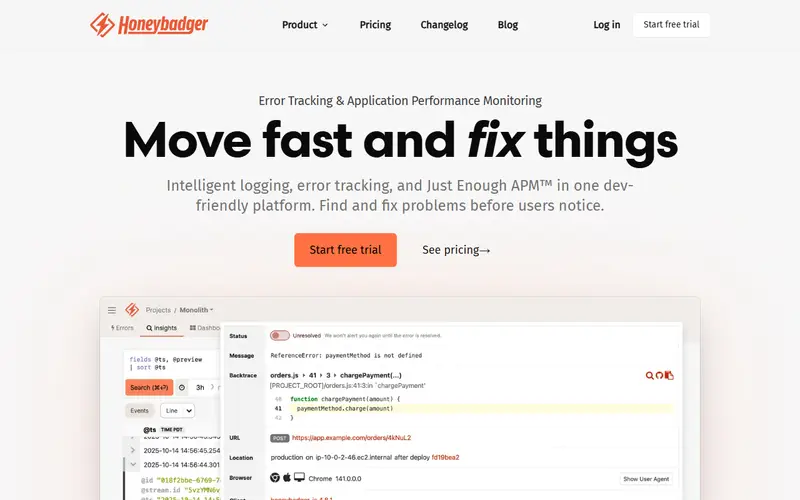
Bootstrapped all-in-one monitor for web apps: error tracking, logs and light APM, uptime and cron checks, and status pages, with a free solo plan and flat team pricing.
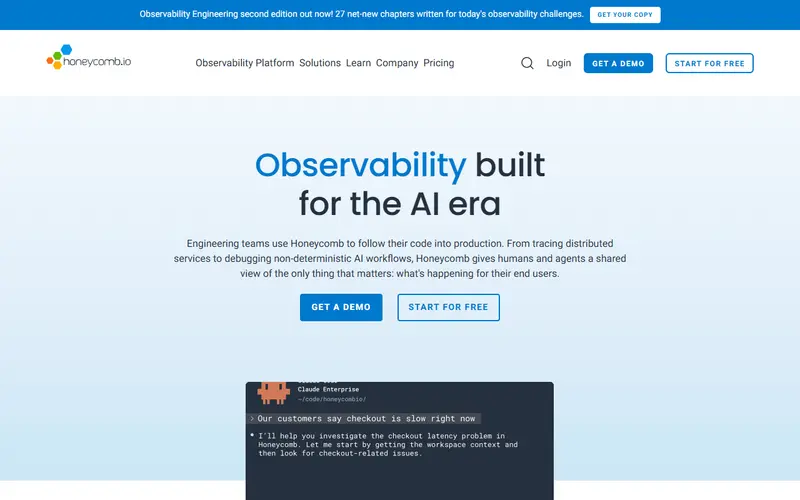
OpenTelemetry-native observability built on high-cardinality events and distributed tracing, priced by event volume with unlimited users and a free 20M-event plan.
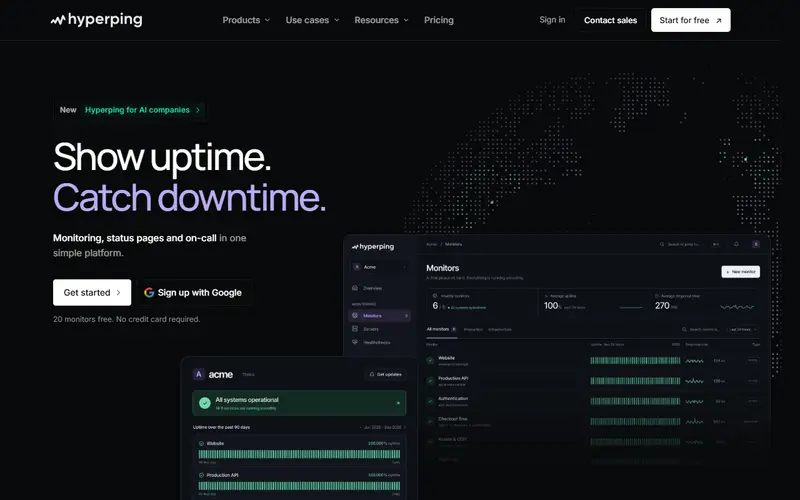
Uptime monitoring from 18 regions with status pages, server agents, browser checks and on-call escalation in one product, with a free plan of 20 monitors.
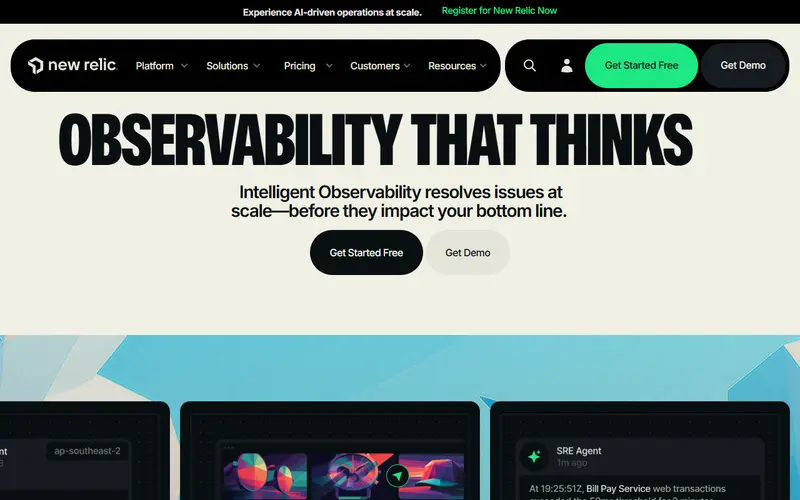
Full-stack observability billed by data ingested and user seats instead of hosts, with a free tier of 100 GB a month and one full user.
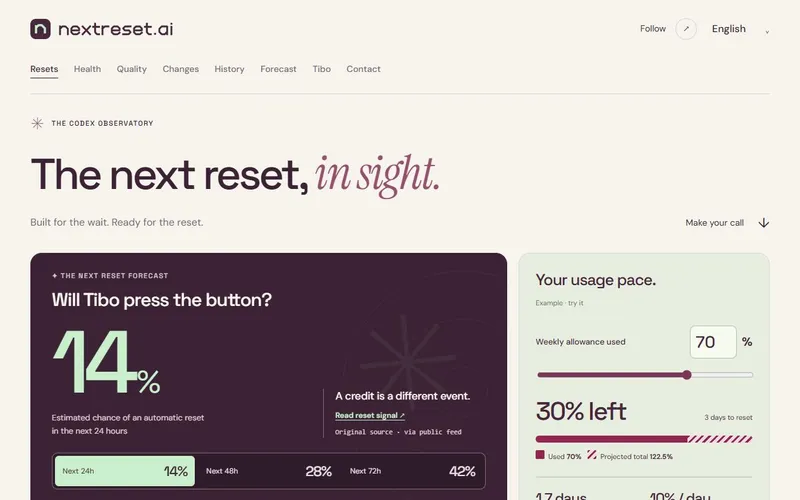
Free independent dashboard for OpenAI and Anthropic incidents, Codex reset announcements and client releases, with source links, RSS and optional browser alerts.
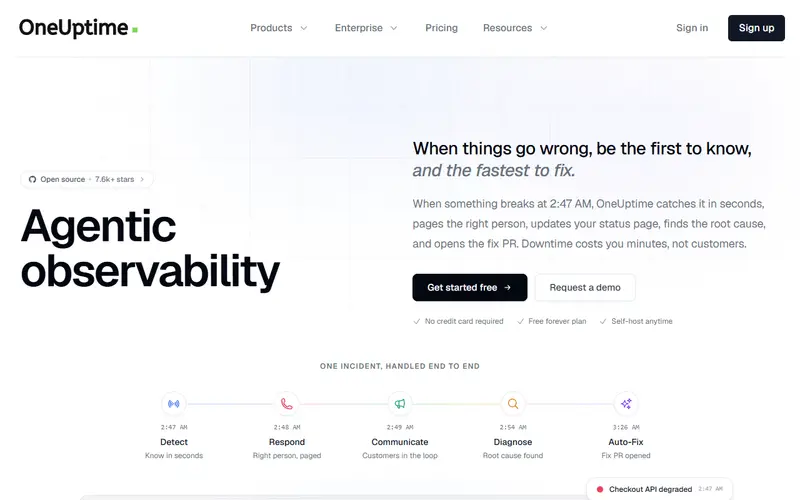
Open-source platform that bundles uptime monitoring, status pages, incident management, on-call, logs, traces, metrics and error tracking, hosted with $1 monitors or self-hosted.
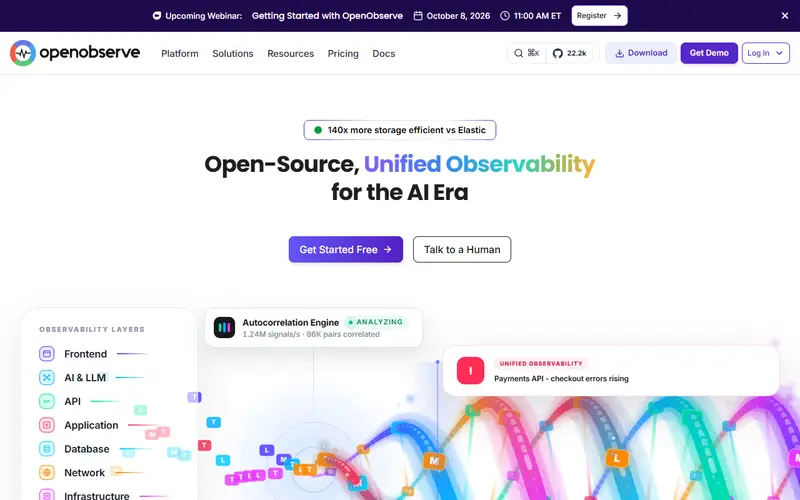
Rust-based, AGPL-licensed observability platform for logs, metrics, traces, RUM and errors, storing data as Parquet on object storage, self-hostable or in the cloud per GB ingested.
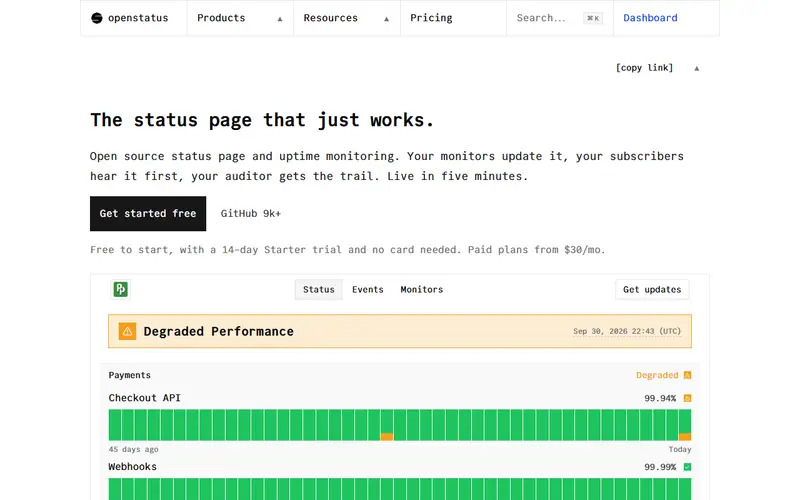
Open-source status page and uptime monitoring platform checking from 28 regions across three clouds, with monitors defined as YAML, Terraform or CLI and flat pricing with unlimited members.
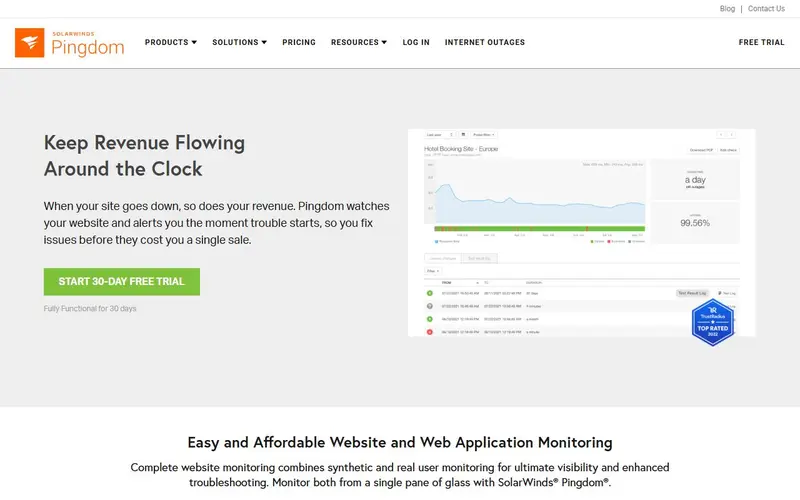
SolarWinds' website monitoring service for uptime, page speed and scripted transaction checks from 100+ locations, plus real user monitoring, sold in check-count tiers with no free plan.
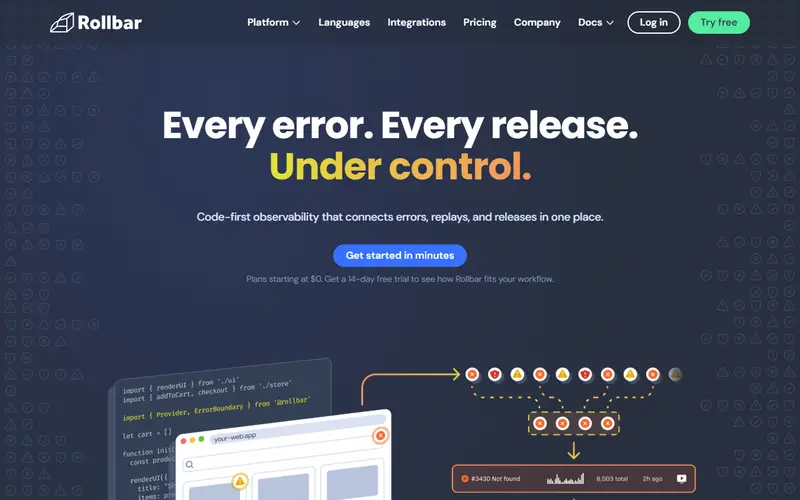
Real-time error tracking with grouping, deploy tracking and session replay, unlimited users on every plan, and a hard stop at the plan limit by default to avoid surprise bills.
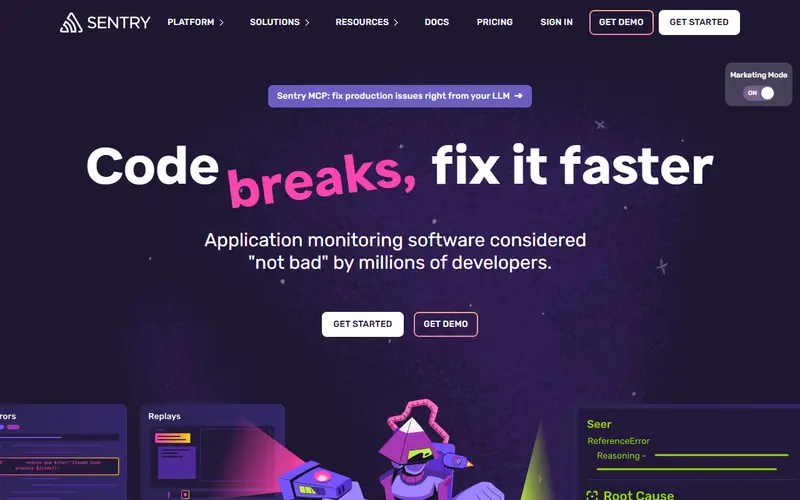
Error tracking with stack traces, tracing, session replay, logs and cron/uptime checks, all linked by trace, with a free single-user plan and a self-hosted option.
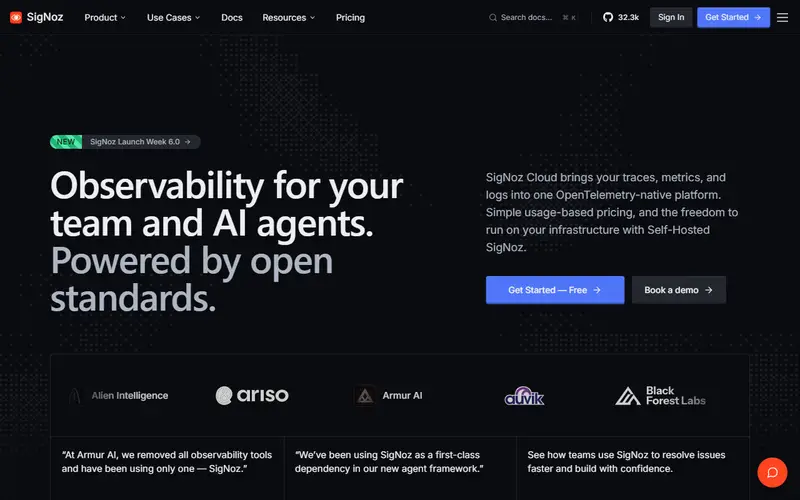
Open-source, OpenTelemetry-native alternative to Datadog with APM, traces, logs, metrics and alerts in one UI, self-hostable free or on SigNoz Cloud from $49 a month.
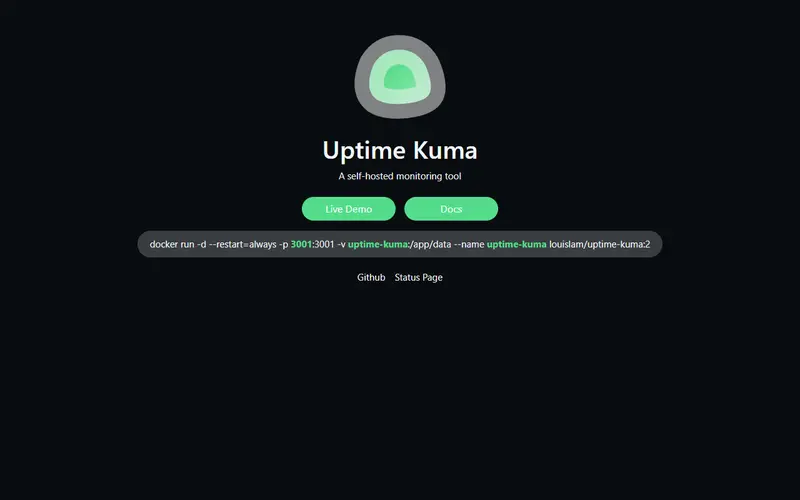
Free, MIT-licensed uptime monitor you run yourself with one Docker command, with 20-second checks, status pages and 90+ notification services.
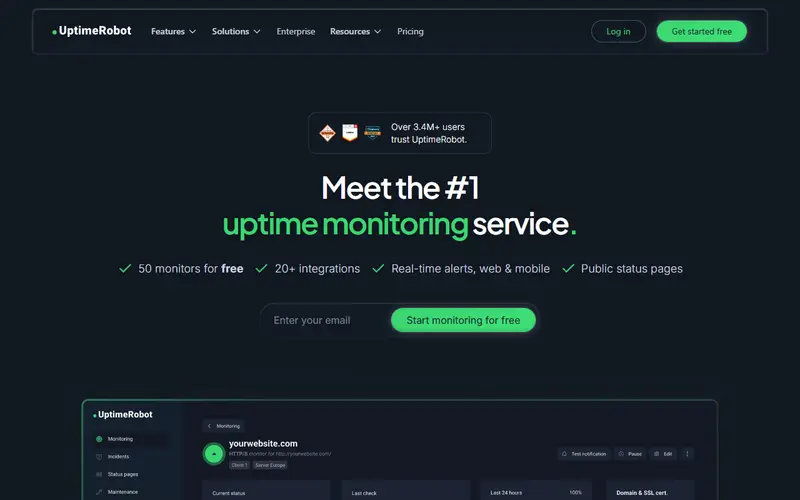
Long-running uptime monitor with 50 free monitors at 5-minute checks, plus paid plans for faster intervals, more status pages and team seats.
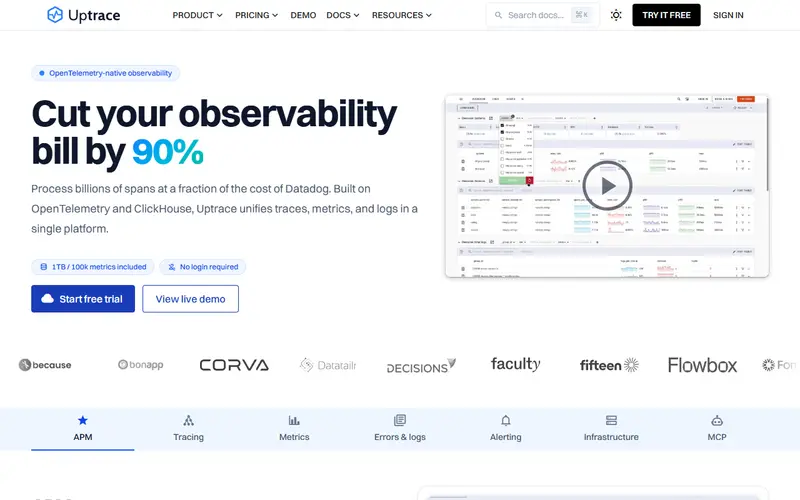
OpenTelemetry-native APM on ClickHouse with traces, metrics and logs in one UI, self-hostable from GitHub or hosted in Germany at low per-GB prices with 50 GB free monthly.
| Tool | Pricing | Covers | Free allowance | Interval / retention | Status pages |
|---|---|---|---|---|---|
| Amazon CloudWatch aws.amazon.com · EU | Freemium | Metrics, logs, alarms, traces, synthetics, RUM | 10 metrics, 10 alarms, 5 GB logs, 3 dashboards | OTel metrics stored 15 months | No |
| AppSignal appsignal.com · EU | Freemium | APM, errors, logs, hosts, uptime, cron | 50K requests, 1 GB logs/mo | 5-day retention on free | Free public status page with uptime |
| Axiom axiom.co · EU | Freemium | Logs, traces, events, metrics | 500 GB loading, 10 GB-hrs query, 25 GB stored | 30 days free; configurable on Axiom Cloud | No |
| Better Stack betterstack.com · EU | Freemium | Uptime, status pages, on-call, logs, traces, errors, RUM | 10 monitors, 100k exceptions, 3 GB logs | 3 min free, down to 30 s paid | 1 included; extra public page $12-15/mo |
| Bugsink bugsink.com · EU | Freemium | Errors | 15K events/mo hosted (1 user); self-host free | 5K events retained free; 75K on $16 plan | No |
| BugSnag bugsnag.com | Freemium | Errors, crashes, performance, tracing | 7.5k events + 1M spans/mo, 1 user | 7 days free; 60 days paid | No |
| Checkly checklyhq.com · EU | Freemium | Uptime, API and browser synthetics, status pages | 10 monitors, 1k browser + 10k API runs/mo | Yes; custom domain from Starter | |
| Coroot coroot.com · OSS · EU | Open source | APM, infrastructure, logs, traces, profiling (eBPF) | Community Edition free, self-hosted | No | |
| Cronitor cronitor.io | Freemium | Cron jobs, uptime, heartbeats, status pages, RUM | 5 monitors, 1 status page | 5 min free, 30 s Business, 5 s Enterprise | 1 basic free; branded $25/mo, private $50/mo |
| Dash0 dash0.com | Paid | APM, traces, logs, metrics, RUM, synthetics | None; 14-day unlimited trial | 30 days spans/logs; 13 months metrics | No |
| Datadog datadoghq.com · EU | Freemium | Infrastructure, APM, logs, synthetics, RUM, security | Up to 5 hosts, 1-day metric retention | Logs 3 to 30 days indexed; Flex up to 15 months | No public status pages |
| GlitchTip glitchtip.com · OSS · EU | Open source | Errors, performance, uptime, logs | 1,000 events/mo hosted; self-host free | No | |
| Grafana Cloud grafana.com · OSS · EU | Freemium | Metrics, logs, traces, profiles, dashboards, synthetics | All services with limits, e.g. 50 GB traces/mo | 14 days free; 13 months metrics, 30 days logs on Pro | No |
| Healthchecks.io healthchecks.io · OSS · EU | Freemium | Cron and heartbeat monitoring | 20 checks | Your schedule (period + grace, or cron expression) | Status badges only |
| Honeybadger honeybadger.io | Freemium | Errors, logs, APM, uptime, cron, status pages | 5k errors/mo, 50 MB/day logs, 1 monitor | Errors 15 days free, 90 Team, 180 Business | 1 on every plan |
| Honeycomb honeycomb.io · EU | Freemium | Tracing, events, metrics, SLOs | 20M events, 100M metric data points/mo | No | |
| Hyperping hyperping.com | Freemium | Uptime, browser checks, server agents, status pages, on-call | 20 monitors, 1 status page | 5 min free, 30 s paid, 20 s Business | 1 free; 1 to 10 with custom domains paid |
| New Relic newrelic.com · EU | Freemium | APM, infrastructure, logs, RUM, synthetics, errors | 100 GB ingest/mo, 1 full user | At least 8 days default retention on free | No |
| NextReset nextreset.ai | Free | Public AI incidents, reset announcements and client releases | Public dashboard, RSS and browser alerts; no account | Incidents about every 5 minutes; retained up to 90 days | Shared OpenAI/Anthropic dashboard; not a status page for your app |
| OneUptime oneuptime.com · OSS · EU | Freemium | Uptime, status pages, on-call, logs, traces, errors | 1 status page, 100 subscribers; monitors $1 each | Every minute ($1 monitors); down to 10 s | 1 free; unlimited on Growth |
| OpenObserve openobserve.ai · OSS · EU | Open source | Logs, metrics, traces, RUM, errors | Self-host free; Enterprise free to 50 GB/day | Cloud: logs 30 days, metrics 15 months | No |
| openstatus openstatus.dev · OSS · EU | Freemium | Uptime, status pages | 1 monitor, 1 status page | 10 min free, 1 min Starter, 30 s Pro | Yes; 1 to 10 by plan, +$20/mo each |
| Pingdom pingdom.com | Paid | Uptime, page speed, transactions, RUM | None; 30-day trial | Yes, public status pages | |
| Rollbar rollbar.com | Freemium | Errors, session replay | 5k occurrences + 1k sessions/mo | 30 days free; 90 Essentials; 180 Advanced | No |
| Sentry sentry.io · EU | Freemium | Errors, tracing, replay, logs, profiling, cron/uptime | 5k errors, 5M spans, 50 replays, 1 user | 30-day lookback (Team); up to 90 days on paid | No |
| SigNoz signoz.io · OSS · EU | Open source | APM, traces, logs, metrics, exceptions, LLM | Self-hosted Community Edition free | Logs 15 days default on Cloud | No |
| Uptime Kuma uptime.kuma.pet · OSS · EU | Open source | Uptime, heartbeat, status pages (self-hosted) | Unlimited, self-hosted | Down to 20 seconds | Yes, multiple, mapped to your own domains |
| UptimeRobot uptimerobot.com · EU | Freemium | Uptime, heartbeat, SSL, DNS, status pages | 50 monitors, 1 status page | 5 min free; 60 s Solo, 30 s Team, 15 s Scale | 1 free, 3 Solo, 100 Team, unlimited Scale |
| Uptrace uptrace.dev · OSS · EU | Freemium | APM, traces, metrics, logs | 50 GB/mo cloud; self-host free | 28 days default; cold storage up to 100 weeks | No |
No tools match these filters.
How to choose a monitoring tool
- Add two things first: an uptime check with alerts, and an error tracker in your app.
- For logs and traces, pricing is per GB ingested or per event: estimate your volume, then check retention.
- OpenTelemetry support keeps you portable between vendors.
- Self-hosted options (Uptime Kuma, SigNoz) cost nothing but need a server that is not the one you are monitoring.
Questions
What is the best free uptime monitor?
Several services monitor dozens of URLs for free at intervals from 30 seconds to 5 minutes. The table compares free monitors, check interval and status pages.